Add-ons
Add-ons which work with the current Vanted version.
| LMME |
|---|

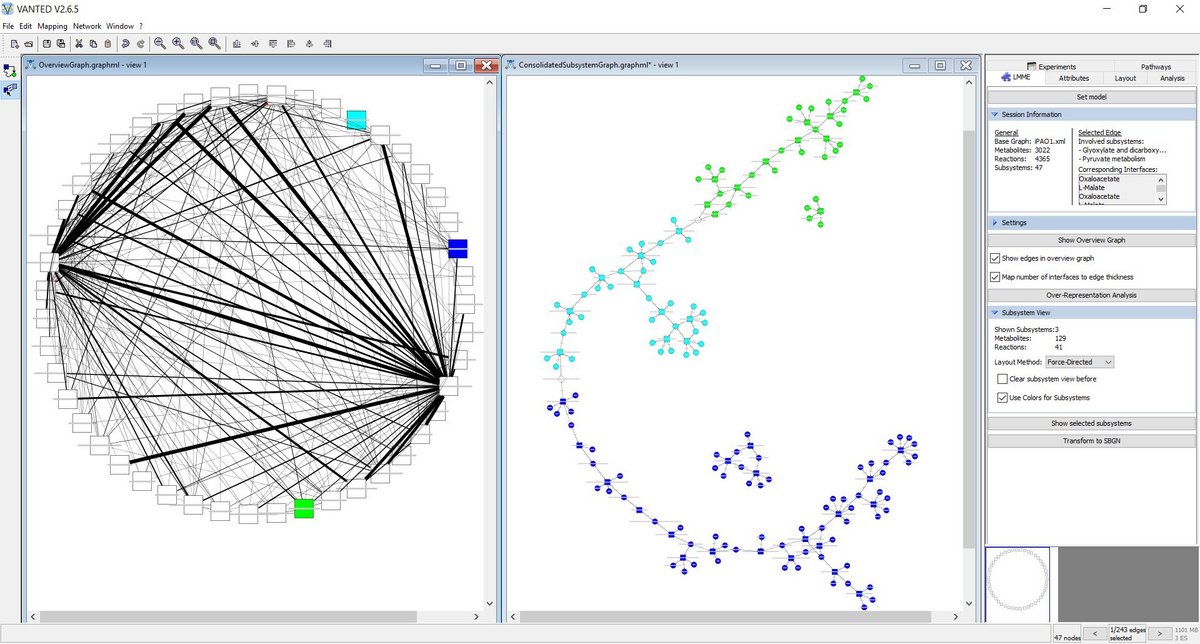
LMME offers interactive features to hierarchically explore these and provides analytic techniques that may be applied successively. In addition to the available decomposition algorithms, we offer an API that allows for the rapid implementation of custom algorithms. Its functionality is complemented by the possibility to use VANTEDs core features during any stage of exploration. (Publication)
| SBGN-ED |
|---|

SBGN-ED - editing, translating and validating of SBGN maps
SBGN-ED is a VANTED Add-on which allows to create and edit all three types of SBGN maps, that is Process Description, Entity Relationship and Activity Flow, to validate these maps according to the SBGN specifications, to translate maps from the KEGG and MetaCrop pathway databases into SBGN, and to export SBGN maps into several file and image formats.
SBGN (Systems Biology Graphical Notation) is an emerging standard for graphical representations of biochemical and cellular processes studied in systems biology. (Publication)
| MAVISTO |
|---|

MAVisto - Motif Analysis and Visualisation Tool
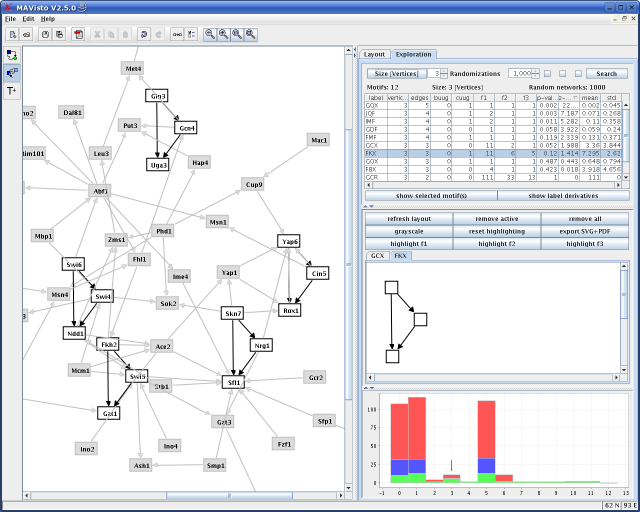
MAVisto is a tool for the exploration of motifs in network. It provides a flexible motif search algorithm and different views for the analysis and visualisation of network motifs. MAVisto is written in Java and is based on Gravisto, an editor for graphs and a toolkit for implementing graph algorithms. It is available free of charge and can be used with Java Web Start. To start the tool, 1) Install Java, 2) Download and double-click mavisto.jnlp or use javaws from the command line as shown below. (Publication)
javaws https://kim25.wwwdns.kim.uni-konstanz.de/vanted/addons/mavisto/mavisto.jnlp
| CentiLib |
|---|
CentiLib - computation of network centralities
CentiLib is an Add-on for the computation and investigation of weighted and unweighted centralities in biological networks. CentiLib was developed to integrate the computation of centralities into as many tools for the visualisation and analysis of biological networks as possible. In addition it can also be used for other types of networks, too. (Publication)
| FluxMap |
|---|

FluxMap - visual exploration of flux distributions in biological networks
FluxMap is an easy to use tool for the advanced visualisation of simulated or measured flux data in biological networks. Flux data import is achieved via a structured template basing on intuitive reaction equations. Flux data is mapped onto any network and visualised using edge thickness. Various visualisation options and interaction possibilities enable comparison and visual analysis of complex experimental setups in an interactive way. (Publication)
